I’ve been checking the COVID-19 Dashboard for the county I live in daily, and I’ve noticed that there have been changes to the way the data is presented. Any of the more alarming charts showing unfavorable trends have been removed, and replaced with more favorable-looking charts. For instance, today’s chart shows an increasing number of tests given (that’s good), and also shows the percentage of positive cases as a result of the testing, which is somewhat flat at 7%. (screenshot below from 2020-05-22)
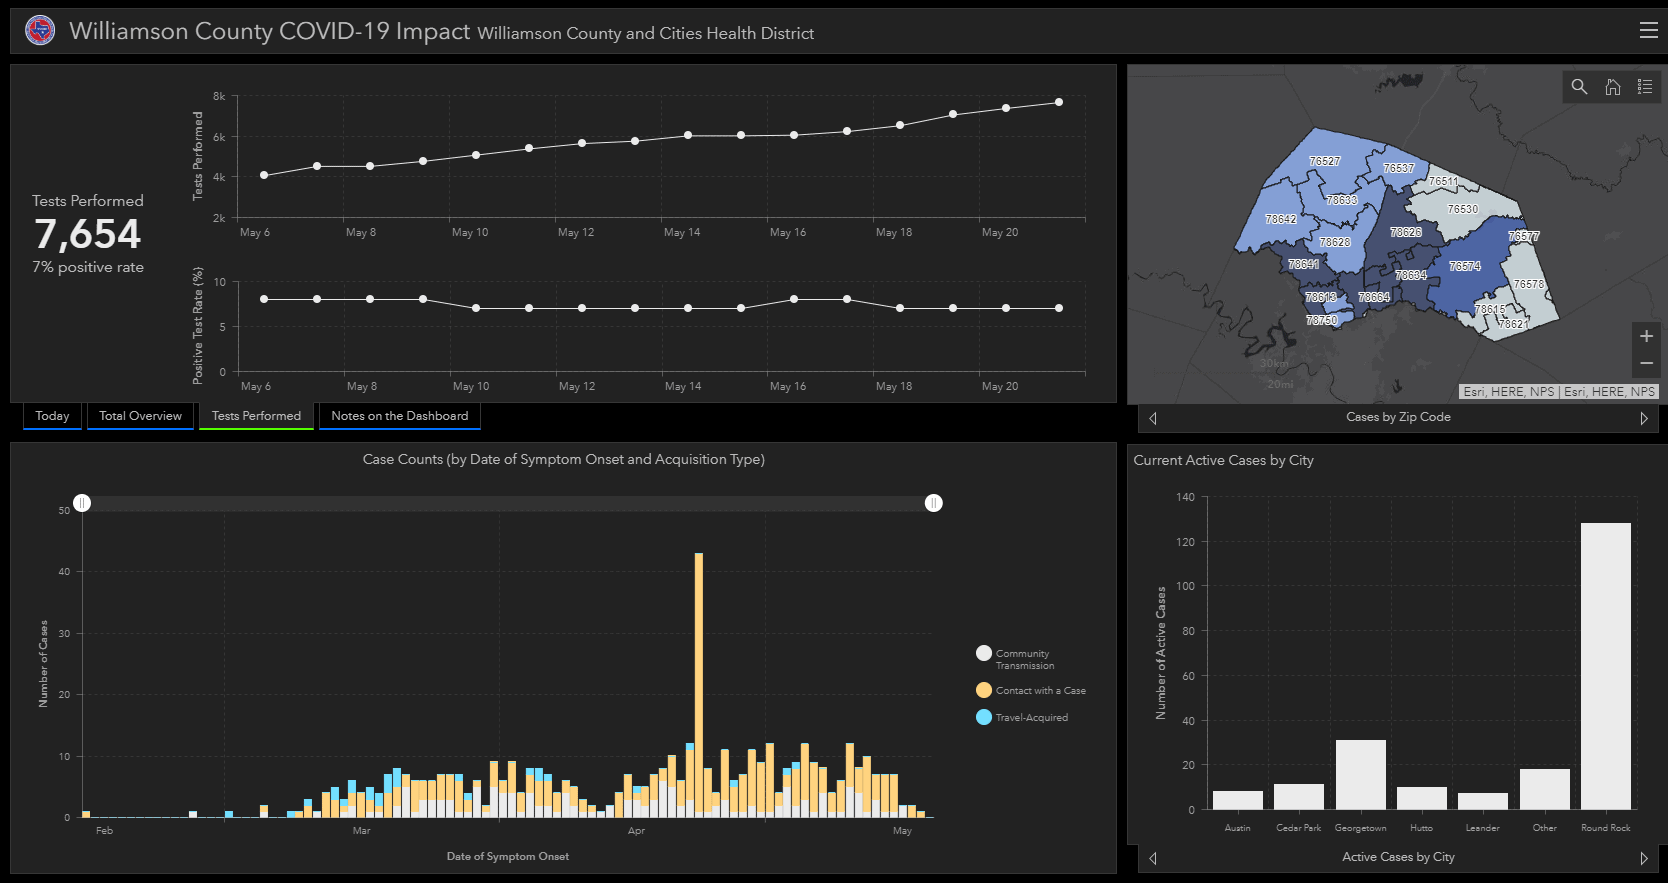
However, they don’t show a chart that combines that data, which would show an upward trend.
Just 10 days ago, “Cases Over Time” was one of the charts being shown (screenshot from 2020-05-12), but has since been removed:
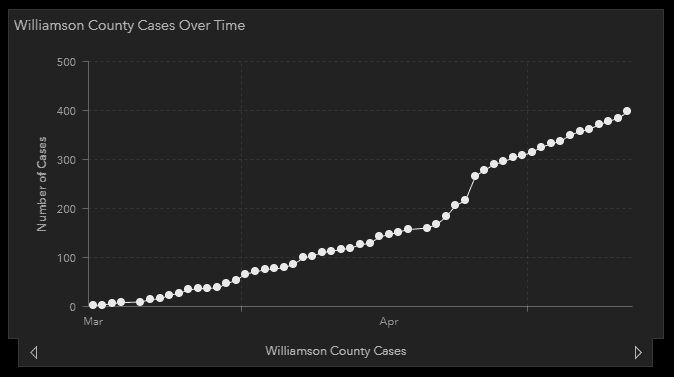
This chart, which shows no downward trend, is not supportive of the Texas government’s efforts to re-open the state. And my guess is that there was some kind of government communication to the owners of state dashboards to only show certain charts that support (or not damage) their cause. I don’t think this is an unreasonable suspicion given the fact that data suppression/manipulation was going on in Florida. I’m not saying the data for Texas is being manipulated, but the presentation of that data is – and in a way that supports the argument that Texas should open sooner rather than later.
I’ve found another resource for data here, and with a little digging, you can find data presented in ways that you can pick and choose to support different viewpoints. For instance, here’s a screenshot of today’s trend (2020-05-22), which is not very encouraging:
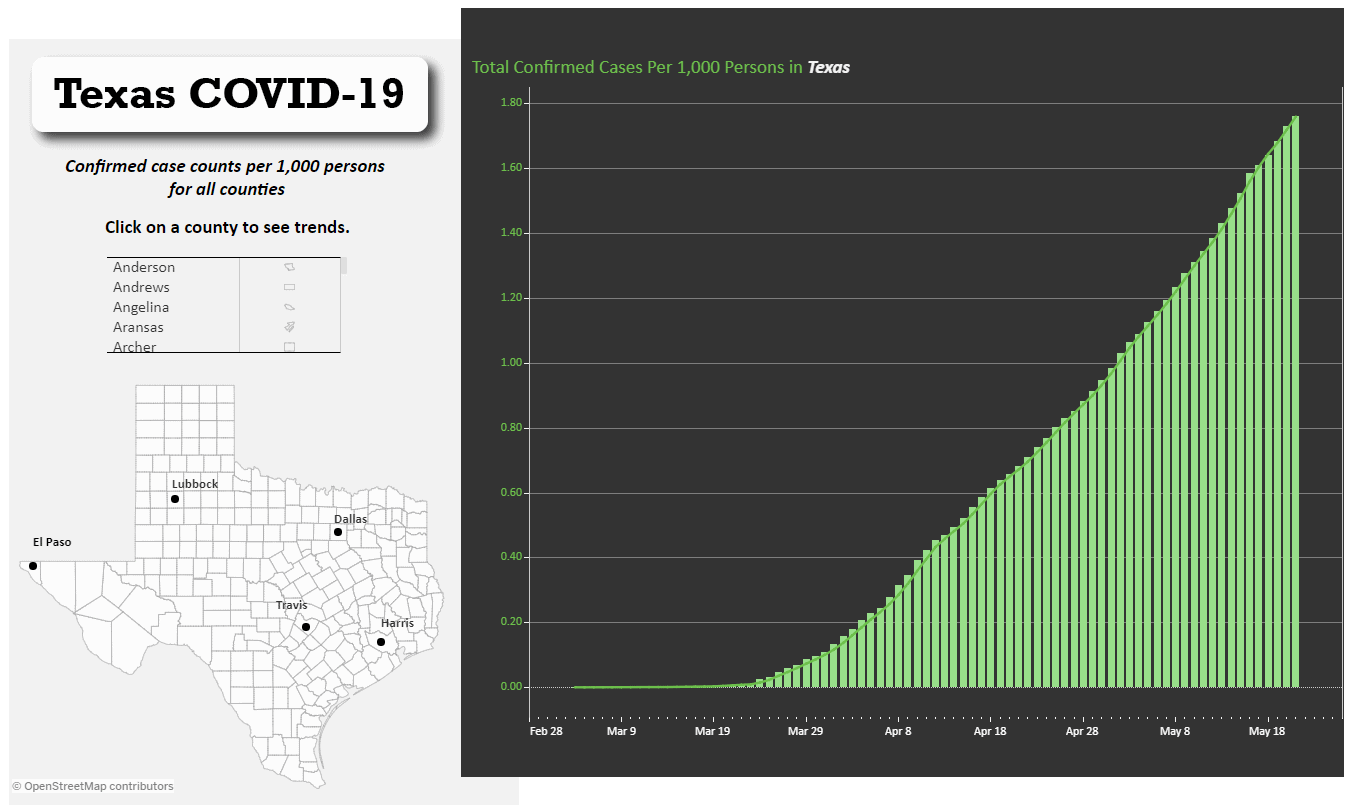
We’re not out of the woods yet, folks. We might still be lost in the middle of the woods. 😟 Please keep practicing social distancing, wash your hands, and stay home if you can!


Texas does what Texas wants and only for Texas. Really not surprised.